One tool is the SQL Trace option in the Options menu. This is a good and easy way to quickly trace simple SQL that executes, but it misses some important queries that run from deep in the kernel.
The other tool is the TraceParser. This tool requires a ton of initial setup and requires an Admin to run the tool. This is a big problem (aka. A big no-no) for anyone who works in an environment stacked with PCI and SOX compliance guidelines to follow, especially when trying to trace an issue in your Production environment. Plus when you do get it working and get proper sign-off from the executives of your business, there is a lot of work in analyzing the results, having to drill down into nested tree structures on EVERY line just to get to the query that ran. But it does do a good job matching up what query got ran from what line. In my opinion, it's a lot more work than necessary.
The caveat with both of these tools, it sometimes misses some queries that are executed, especially those that involve schema changes or other ALTER statements. Luckily, I've found an easy way to use a tool we are all familiar with, SQL Profiler. If you're not familiar, you should become well acquainted. As we know, SQL Profiler will monitor and report just about every event you can throw at a SQL server. Now, if you simply run a trace while running something in DAX and look at the resulting queries, you'll see the structure of the query, but there will be parameters (ie. @P1, @P2, etc.) in place of the real values that will be used in the query. This makes it very difficult to determine what the query actually returned (result set).
What is interesting, if you look at the RPC:Starting event just before the query in question, you will see the real values of those parameters in the last part of TextData column. Even then, looking at it, it still isn't easy to determine where those values go in the next query.
What I did is analyze a good amount of these profile trace (*.trc) files and wrote a program that parses a *.trc file and converts it to a text file that replaces all parameters with the real values so it is easier to determine what your result set REALLY is. The link is below:
SQL Trace File Parser
It isn't perfect but I did my best. It then uses a web service I found to format (indent/line break) the queries and writes them out to the text file (that also isn't perfect either, you might get really long one liners, sorry).
How to Use
- First, we need to open SQL Profiler. Easy enough.
- We'll need to create a Template in the File->Templates->'New Template...' menu.
- Give your template a name, I named mine DAX_TRACE
- Click on the Events Selection tab
- SQL Profiler will trace everything that is thrown at it so we need to filter it to specific only trace events fired by DAX. Make sure that both the checkboxes ('Show all events' and 'Show all columns') are checked and click on 'Column Filters...' and filter the two columns
- Application Name = "Microsoft Dynamics AX" (no quotes)
- Database Name = <The Database your DAX environment uses>


You may choose additional filters as you see fit. - Now we will need to select events and columns we will be tracing
- You may select any/all events/columns you wish but you need at least the following events:

- RPC:Starting
- SP:StmtCompleted
- SQL:StmtCompleted
- TextData
- SPID
- ObjectName
- 'Save' the template
- Now we are set up and can trace with this same template anytime we wish.
- Let's begin tracing by clicking on the 'New Trace' button. It'll ask you to connect to a SQL Server. Enter the SQL Server information and make sure it successfully makes a connection.
- A new window opens to provide you with options as to how you wish to trace the server. You can give the trace a name, it doesn't matter if you leave it. You should then select the template in which we just created in the 'Use the template' drop-down list. Nothing additional is needed, we can worry about saving the trace file after it runs, it's not necessary to tell it where to save ahead of time.
- When you are ready and you have a DAX client up and ready to trace, click 'Run' and it will begin tracing.
- Perform the tasks you want in the DAX client.
- When desired, you may stop the trace by hitting the 'Stop' button.
- Save this as a Trace file by clicking File->'Save As'->'Trace File...' and find a place to store the file.
- Open SQL Trace File Parser (download from above) and browse for the file we just traced.
- By default, the text file will save in the same directory/filename as the trace file but with a *.sql extension instead.
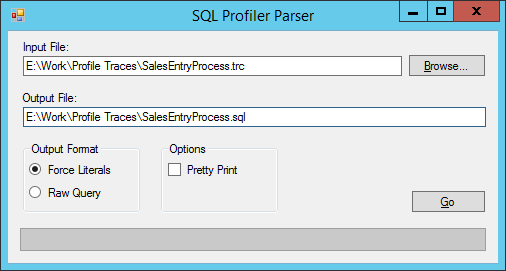
- The Output Format is defaulted to 'Force Literals' which simulates what the query would look like if you use the forceliterals keyword in your query (replaces the parameters with real values). 'Raw Query' will just give you the original parameterized query.
- The Options show Pretty Print, which uses a 3rd party web service to format the SQL with proper indentation for easy readability. If this service is unavailable and it fails, please uncheck it.
- Click Go and watch it churn away.
- Open the *.sql file and look at the beautiful SQL it found.
- As usual, if you spot any bugs please send message me and provide the *.trc file if possible.
Change Log:
2014-12-10 - Feature - Changed the default output filename to a *.sql instead of *.txt
2014-12-10 - Feature - Added the option to use or not use a 3rd party web service to format the SQL
No comments:
Post a Comment